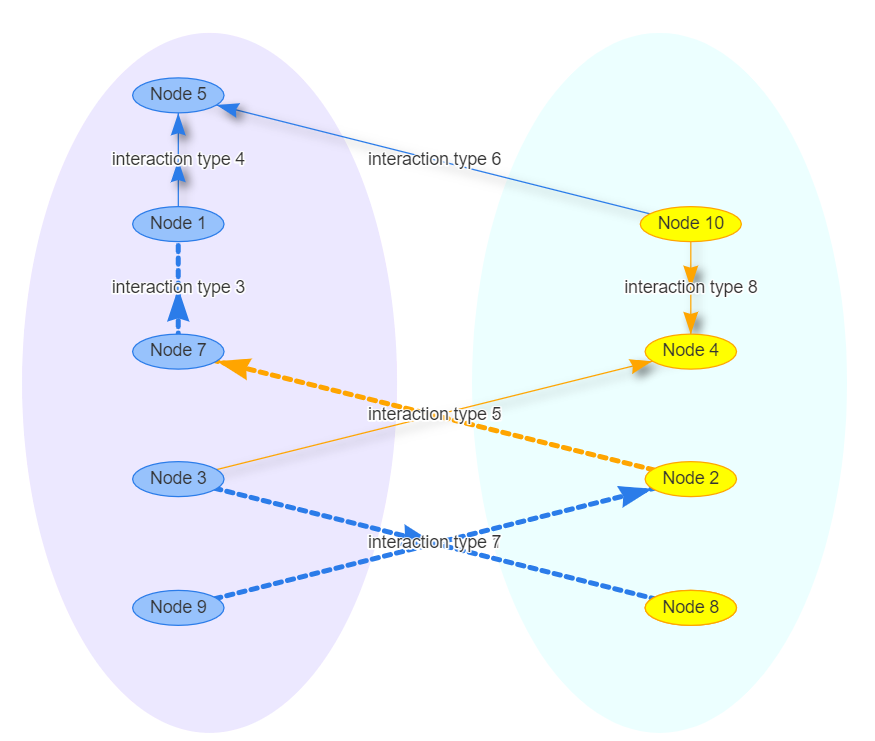
In the following vis-network I have 2 groups of nodes. I have separated the 2 groups of nodes into left and right side by accessing the node positions after generating a layput_as_tree. Now would like to draw a circle or ellipse around the node groups.
here is a reproducible example
require(shiny)
require(visNetwork)
server <- function(input, output) {
  output$network <- visNetwork::renderVisNetwork({
    edges <- data.frame(
      from = sample(1:10, 8),
      to = sample(1:10, 8),
      label = paste("interaction type", 1:8),
      length = c(100, 500),
      width = c(4, 1),
      arrows = c("to", "from", "middle", "middle;to"),
      dashes = c(TRUE, FALSE),
      title = paste("interaction name", 1:8),
      smooth = c(FALSE, TRUE),
      shadow = c(FALSE, TRUE, FALSE, TRUE)
    )
    nodes <- data.frame(
      id = 1:10,
      group = c("A", "B"),
      label = paste("Node", 1:10),
      shape = "ellipse"
    )

    # save the graph in variable
    g <-
      visNetwork::visNetwork(nodes, edges, height = "500px", width = "100%") %>%
      visNetwork::visIgraphLayout(layout = "layout_as_tree")

    # access the x and y co-ordinates to arrange the groups
    coords <- g$x$nodes %>%
      dplyr::mutate(x = abs(x)) %>%
      dplyr::mutate(y = abs(y)) %>%
      dplyr::mutate(x = ifelse(group %in% "A", -x, x)) %>%
      dplyr::select(x, y) %>%
      as.matrix()

    #' replot the network with the new co-ordinates
    visNetwork::visNetwork(nodes, edges, height = "500px", width = "100%") %>%
     visNetwork::visIgraphLayout(
      layout = "layout.norm",
      layoutMatrix = coords,
      randomSeed = 1,
      smooth = T
    )
  })
}

ui <- shiny::fluidPage(
  visNetwork::visNetworkOutput("network",
    width = "1000px", height = "700px"
  )
)

shiny::shinyApp(ui = ui, server = server)


1.any point on the node (so that way we can get the parent container nodes coords),2.the height and width of any node (for parent nodes), and3.where the coordinates are "centered" around on the node - ie (x, y) is the top left, bottom right, center, etc. Sorry I didn't reply the 8th, I didn't receive a notification message, @user5249203. – Afterwardctrl+shift+ior variations of it will do that. – Afterward